Fungal gene cluster

241

Fungal species


7597

GeneCluster


97159

Gene

News

  • 2023-10-06:  The results of RNAseq data for some fungi were supplemented

  • 2023-08-07:  Species gene cluster information download module complete

  • 2023-06-01:  Single gene browser complete

  • 2023-03-25:  Custom enrichment analysis module complete

  • 2023-01-22:  The fungal gene cluster database is basically completed

  • 2022-12-12:  Whole Genome browser and gene browser complete

  • 2022-10-25:  Enrichment analysis with gene cluster as background was realized

  • 2022-05-23:  Blast features are integrated into the site

  • 2022-02-10:  Fungal gene cluster database project begins

Fungal Gene Cluster Database (FGDB)

A gene cluster can be as small as two adjacent related genes produced repeatedly, or as large as hundreds of the same genes arranged in tandem. They belong to the same ancestor gene amplification products, but some gene family members are not closely arranged on the chromosome, there are some unrelated sequences in the middle, but generally distributed in the relatively concentrated region of the chromosome. Currently, a total of 44 species of fungi have been included in the FGCD database, including 368 gene clusters and 22,200 genes.If you have any questions, please email ZFY1903617715@163.com

How to cite:

Zhang, F., Cao, H., Si, H. et al. FGCD: a database of fungal gene clusters related to secondary metabolism. Database (2024) Vol. 2024: article ID baae011; DOI: https://doi.org/10.1093/database/baae011 link

Loading...
Loading...


Comprehensive Analysis

Enrich Analysis Result

replot by selecting the terms in the list and clicking Replot below

Background file format requirements

The file is CSV or TSV format and has two columns. The first column is the identifier(such geneid) and the second column is the background information.The first line is to list names.

Download result

Data Download


Gene Cluster Type File

GeneClusterType

The download module provides annotated information on gene cluster results,nucleic acid sequences, protein sequences, and gene cluster genes


Download Result: The genetic information of the entire gene cluster of the species

Nucleotide Sequence: Gene cluster The nucleic acid sequence of a gene

Protein Sequence: The protein sequence of a gene cluster

GFF3 File: Gene cluster gene annotation file


Download Result Nucleotide Sequence Protein Sequence GFF3 File

Tutorial for GeneCluster Database

Introduction


Although fungal secondary metabolites are not essential for maintaining fungal growth, they have important biological functions for fungal metabolism. They are widely used in agricultural chemicals, as raw materials for some drugs, and have important ecological effects. In general, fungal secondary metabolite synthesis genes are arranged in clusters on chromosomes and jointly regulate gene expression. In this paper, the secondary metabolite gene cluster information of different fungi is stored, retrieved and visualized by constructing a fungal secondary metabolite gene cluster database, which provides an objective basis for studying fungal secondary metabolite gene clusters at the molecular biology and epigenetic levels. We developed a fungal gene cluster database (FGCD) for visualization of fungal secondary metabolite gene clusters. The database information comes from the Ensemble database, which is annotated and integrated by antiSMASH, and then the query and visualization of gene cluster results are realized by using the Web framework Shiny of R language. At the same time, the FGCD database integrates the results of our collected RNAseq data analysis and provides Blast and genome browser functions. At the same time, we provide an enrichment analysis function based on gene cluster results. At present, the FGCD database contains 241 fungal secondary metabolite gene clusters, including a total of 7579 gene clusters and 97159 genes. The database is deployed to the cloud server through shiny-server. The fungal secondary metabolite gene cluster database based on R Shiny can identify and describe the secondary metabolite synthesis gene cluster information, and present the gene cluster structure to achieve faster and more complete.


Overview of the FGCD database

Query

1. Query

In the query module of the database, users can filter and find the required gene clusters in a variety of ways. First, users can select specific species as search criteria. This species selection box supports keyword search, users only need to enter the name of the species or related keywords, and then select the type of gene cluster, the system will automatically retrieve the gene cluster information related to the species. The system will return a gene cluster containing all eligible genes, and will display its complete structural information, including the length of the gene cluster, starting position, ending position, etc. At the same time, the system will also display the sequence information of each gene cluster, and users can view the specific sequence content of the gene cluster for further analysis.(Figure 1)


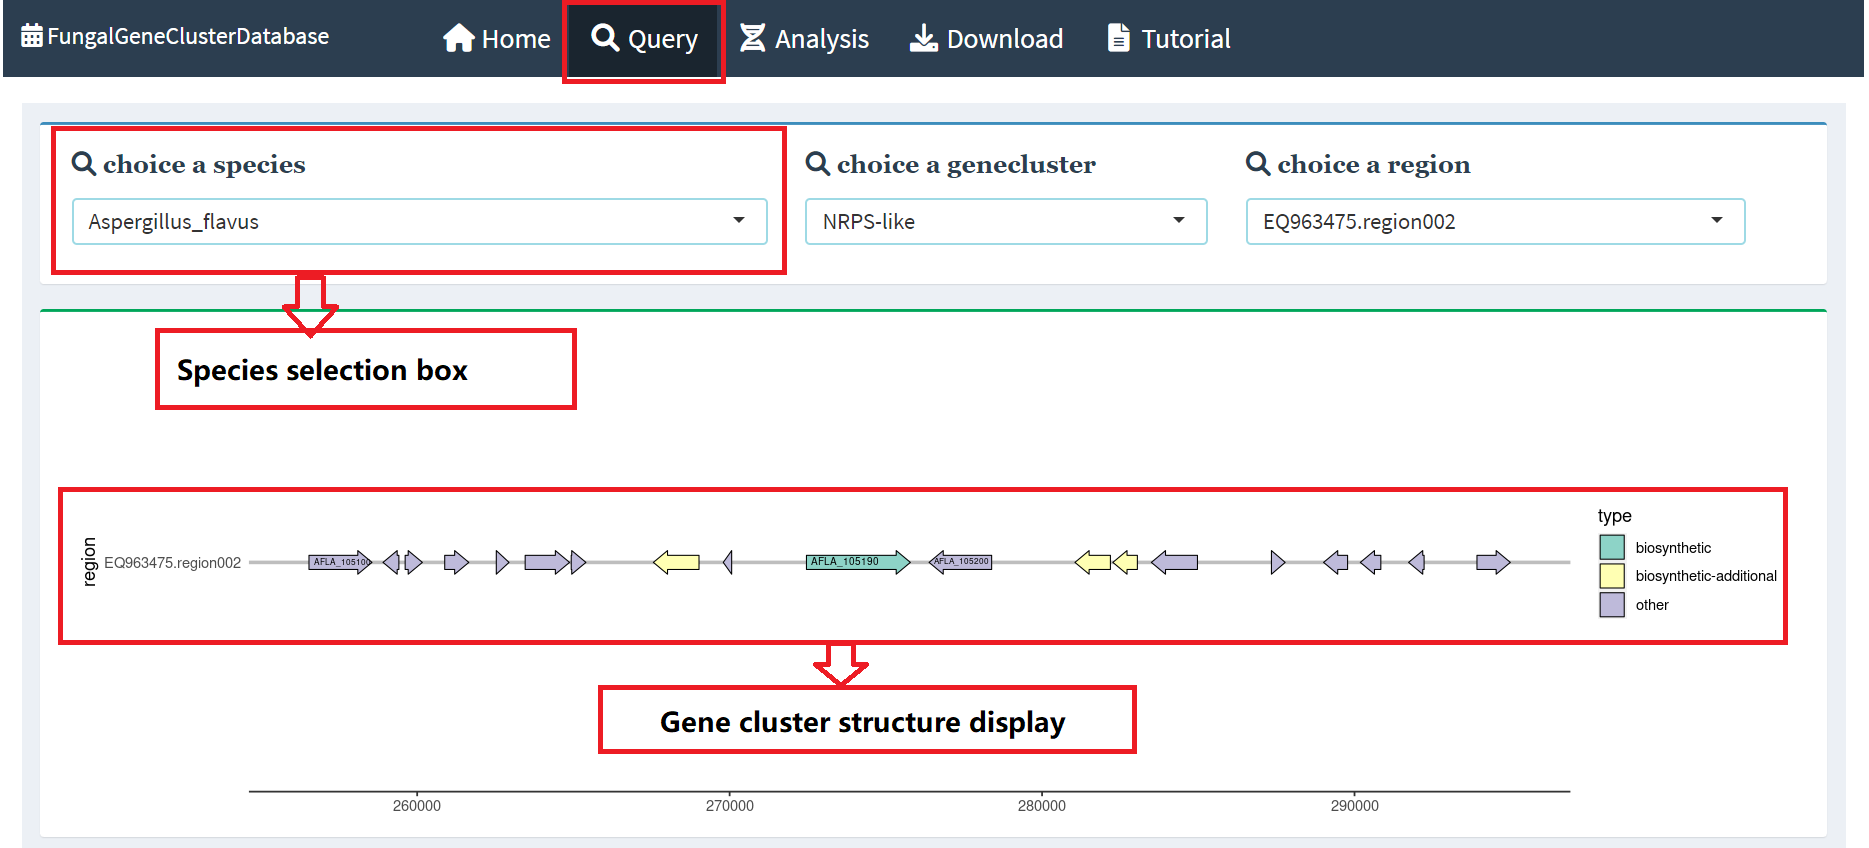
Figure 1. Query a Gene cluster

2. Gene browser

Under the gene structure display in the query interface, we present the name of the gene, location information, and the type and region of the gene cluster in the form of a table. Users simply click on the table above, and the Genome browser below will display more detailed genetic information. In order to provide a more intuitive presentation effect, we placed the resulting transcriptome data in different browser tracks for display. This design not only beautifies the interface, but also makes it easier for users to browse and analyze genetic information(Figure 2).


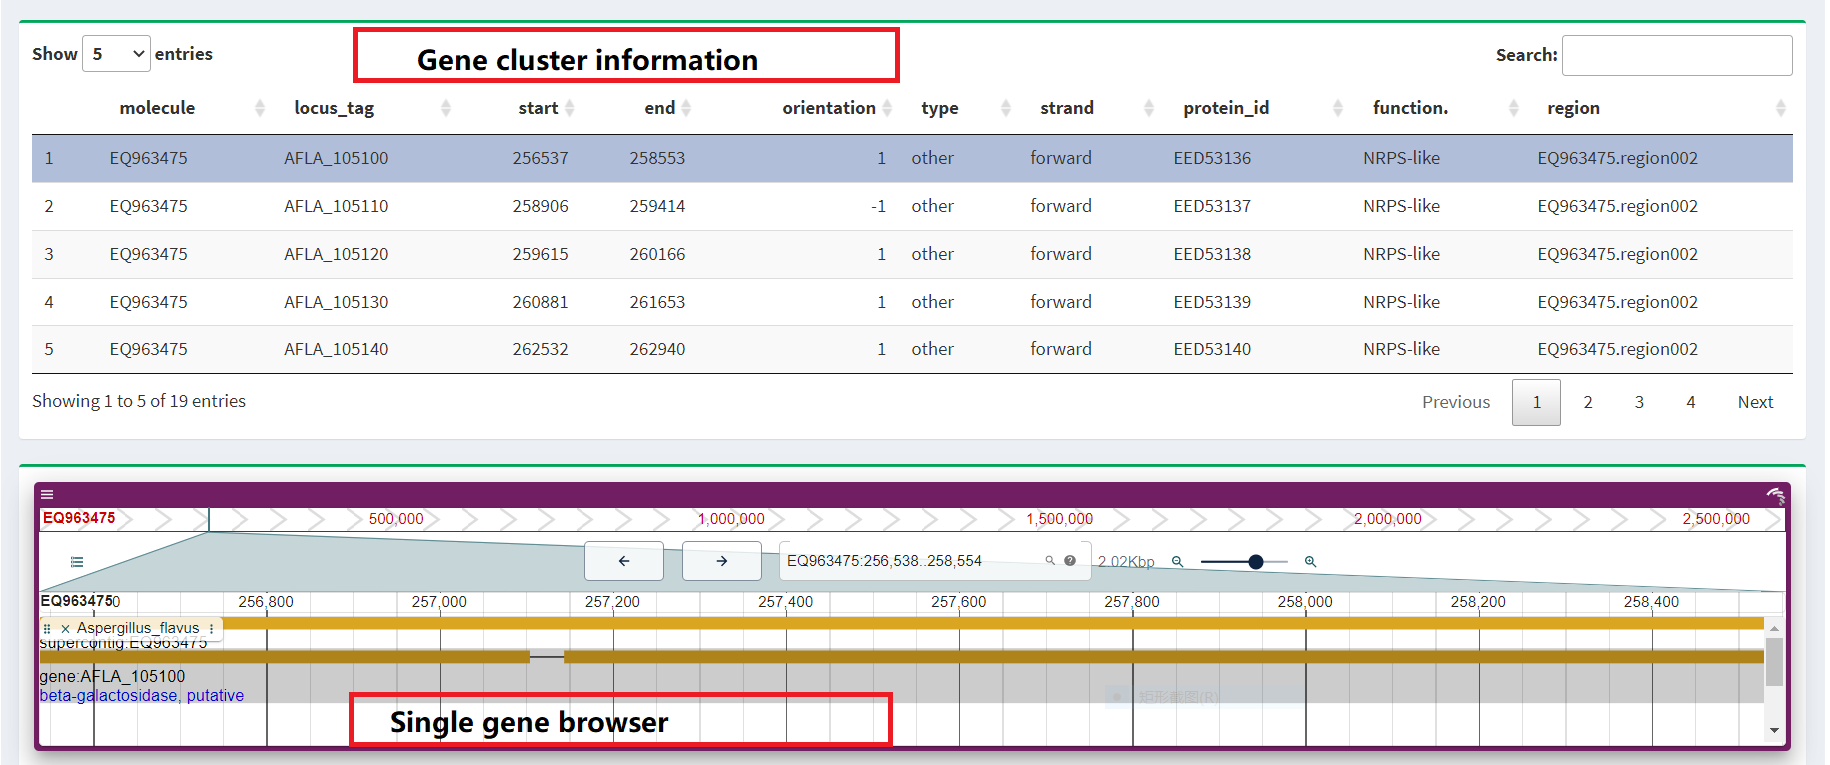
Figure 2. Gene browser

3. RNAseq data

We also provide transcriptome data collected from related species that are analyzed, collated, and screened to eventually form gene clusters that are displayed on the interface. At the same time, we also show the expression levels of these gene clusters so that users can better understand their functions and regulatory mechanisms. In order to facilitate further research, we provide links to the original data so that users can directly access and use the data. We promise that this section will be continuously updated to keep the information and data up to date. You can view the expression of genes of interest by clicking on the genes in the table above.(Figure 3).


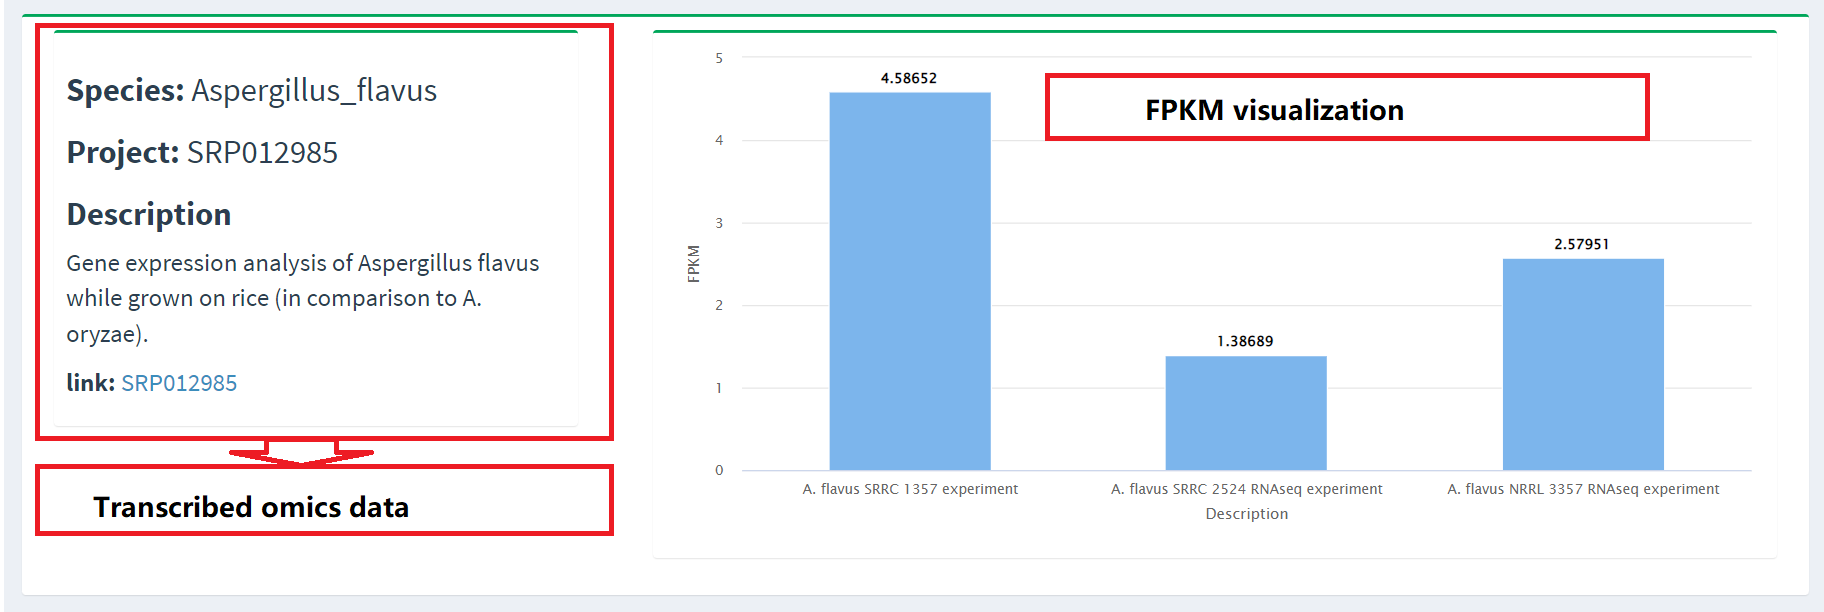
Figure 3. Transcriptome data presentation
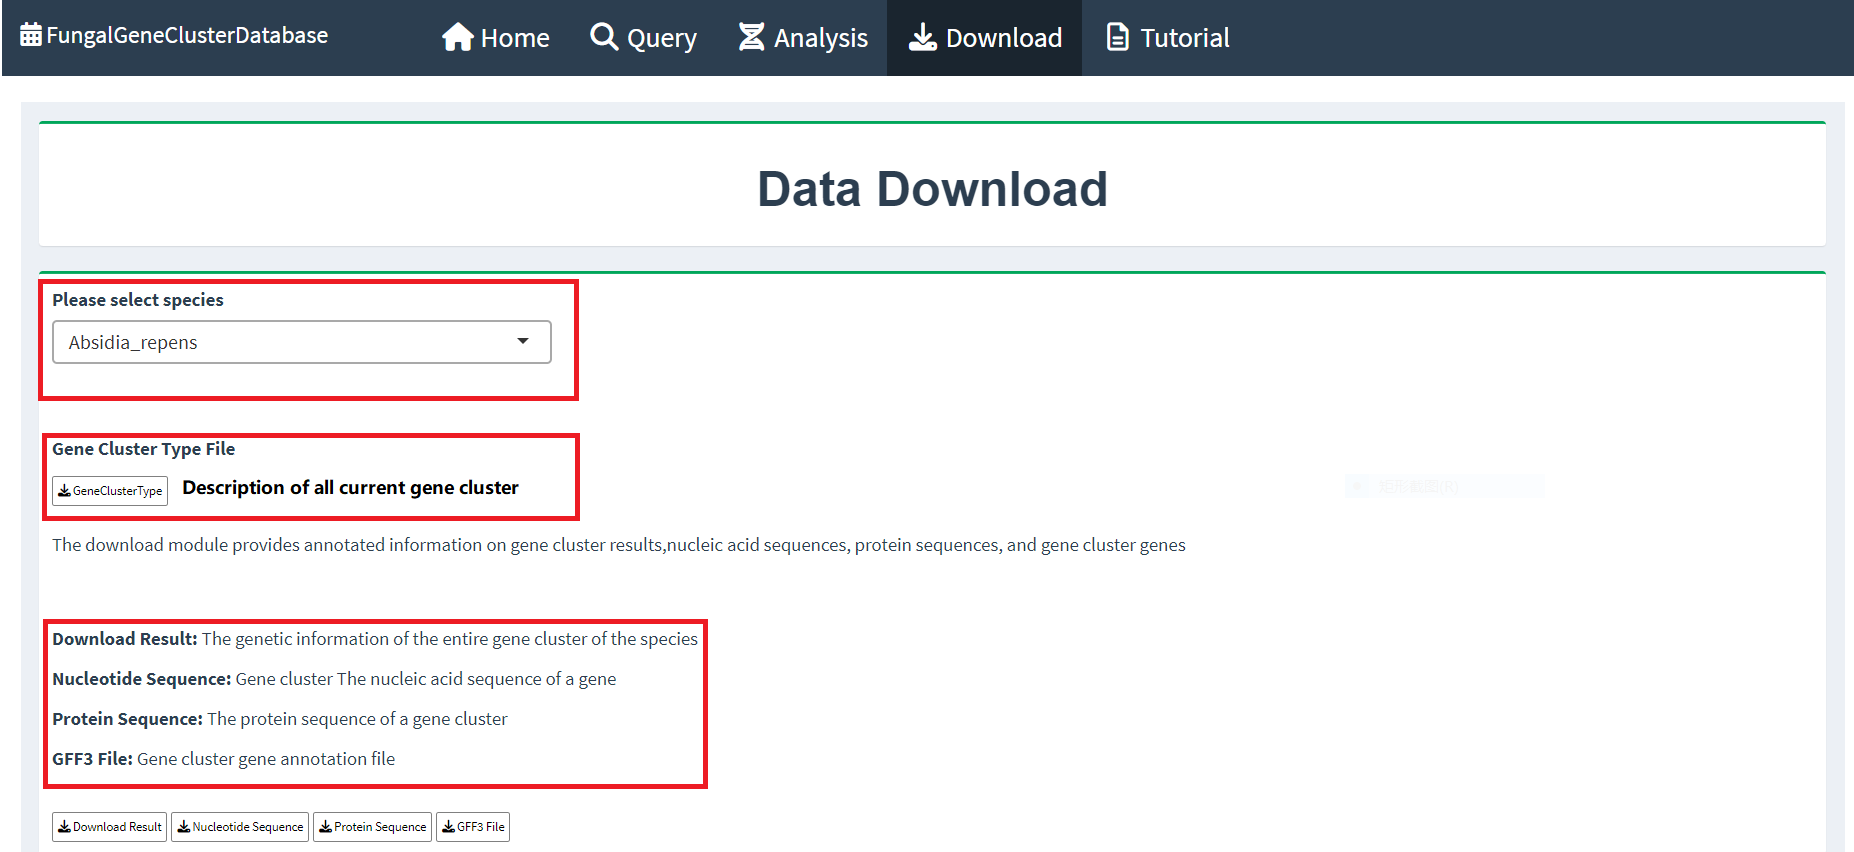
3. Other

At the same time, we provide the user with the sequence information of each gene in the gene cluster. Users only need to click on the corresponding gene in the table above, and the system will display the detailed sequence information of the gene. This design makes it easier for users to view and analyze the sequence contents of specific genes to gain further insight into their functions and characteristics.(Figure 3).


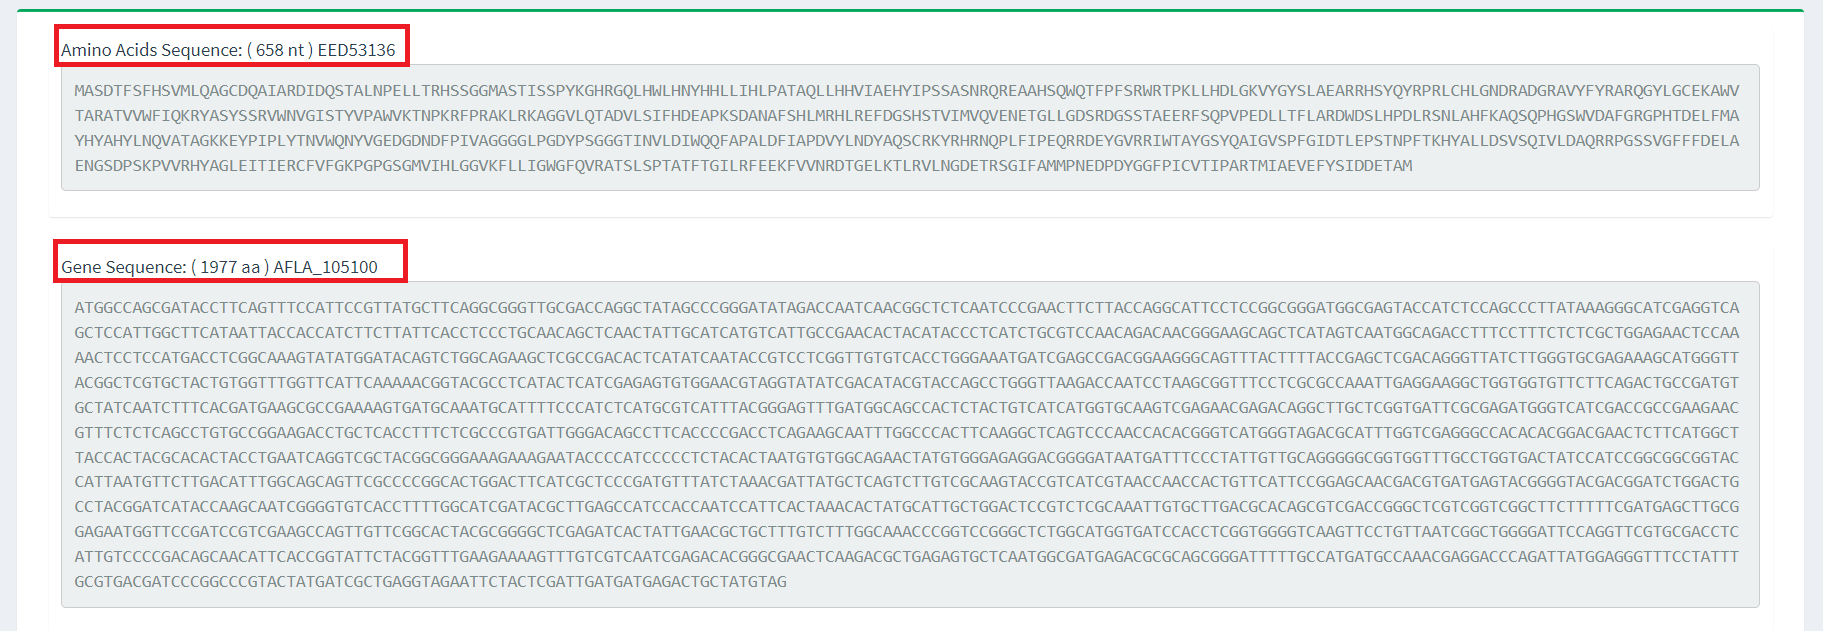
Figure 4. Gene sequence

Analysis

1. Blast

We offer Blast multiple sequence alignment and currently focus on protein sequence alignment. Users can select multiple sequence alignment libraries for a single species in our database for more accurate alignment and analysis. At the same time, we also provide a multi-sequence alignment library that integrates all species sequences, enabling users to conduct more comprehensive comparisons and studies. This design gives users the flexibility to choose a comparison method that suits their needs, resulting in more accurate and comprehensive results.(Figure 1).


Figure 1. Blast interface

2. JBrowse

In addition to providing a gene browser for individual genes in the query interface, we also provide a genome browser for the whole genome. The browser allows users to browse and analyze the entire genome, allowing users to view chromosome structure, locate genes, study gene relationships, and more. Such a design allows users to gain a more comprehensive understanding of the composition and function of the genome, which allows in-depth exploration of the genetic characteristics and evolutionary history of species(Figure 2).


Figure 2. Genome browser

3. Enrich analysis

We use the gene cluster information of each species as background annotation information to provide users with enrichment analysis function based on gene cluster type. Users can choose to enter the ID of gene_stable_id or protein_stable_id. The system will perform enrichment analysis according to the input ID, and generate corresponding bubble charts and bar charts to show the results. This design allows users to intuitively understand the distribution and correlation of different gene cluster types, so as to deeply explore the gene regulation mechanism and functional characteristics of species. At the same time, we also provide the result download function, which is convenient for users to save the analysis results for further research and application.(Figure 3).


Figure 3. Enrich analysis interfere

4. Customized enrich analysis

In order to support enrichment analysis of more species, enrichment analysis of custom background is provided, which only requires uploading background files as required. It also supports the drawing of a specific path selected by the user.(Figure 4).


Figure 4. Customized enrich analysis interfere

Download

Download data

Our database provides a download function so that users can easily access the required files and information. First, we provide explanatory files for all gene cluster types, which detail the definition, characteristics, and relevant background knowledge of each gene cluster type to help users better understand and use the data. In addition, for individual species, we also provide the corresponding gene cluster result file, GFF3 annotation file, nucleic acid sequence file, and protein sequence file. The gene cluster result file contains information about all the gene clusters of the species, including detailed parameters such as location and length. The GFF3 annotation file provides a comprehensive annotation of the genome of the species, including the location of genes, transcript information, etc. The nucleic acid sequence file and protein sequence file provide the DNA sequence and protein sequence of the species respectively, which are convenient for users to conduct further research and application. By making these documents and information available, we aim to provide users with a comprehensive and easy-to-use resource to help them better understand and utilize genomic data.(Figure 1).


Figure 1. Download interfere